
I Decided to Live Book Promotion Animation video

Business Continuity Risk Example
Vyond Animation: (Main Features) Using a known example, this animation illustrates the story with subtitles, voiceover, and animation of scenes to move the story along and keep the learner engaged.
Please click View Project below to view a demo.
Fuzzy Logic – Vyond animation video
Vyond Animation Video: In understanding some of the Fintech terms, fuzzy logic came up in a course and required bitesize approach to helping the Learner understand what fuzzy logic means. The use of an apple is a familiar term internationally, this served as an appropriate medium to explain the technical terms found in fuzzy logic with imagery and animation; including words; images; video; animated infographics.
Please click View Project below to view a demo.

Probability – Adobe Spark in Video
Adobe Spark Video: Probability
Understanding mathematical terms, such as probability, is not always so easy. By using this simple video slideshow in Adobe Spark, the Learner is able to visualise and contextualise Probability for solving mathematical problems. As most mathematical learning material is written facts, sometimes a learner needs to visualise and relate to everyday experiences.
Please click View Project below to view a demo.

Webinar style – VlookUp in Excel
Video Screen Capture: Webinar, talking head, Excel Spreadsheets pre-record video (main feature): Instructor demonstration, knowledge building tutorial.
Used for learners who need an instruction with Tutor style of delivery.
Please click View Project below to view a demo.
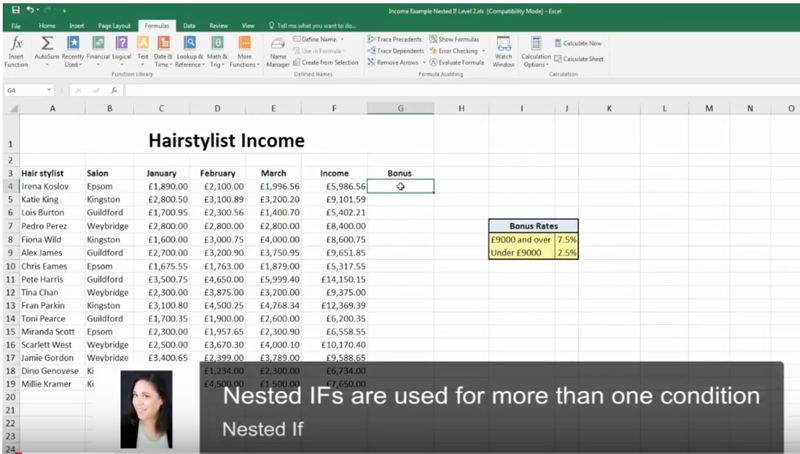
Nested If
Articulate 360 Replay (Main Features): Screen Capture; Lower Third messages
Teaching the Nested If function in Excel. Using a spreadsheet screen capture to help a learner not only learn but troubleshoot. Annotation provided in Articulate Replay with lower thirds at bottom of the screen.
Please click View Project below to view a demo.
Vyond – Animated Chart

Vyond Animation Graphic (main feature): Graph animation using real data to represent the power of constant doubling. Part of a Lesson to demonstrate the concept using ‘Tribbles’ in Star Trek. The visual movement of the graph gives the learner a visual draw concept without a hand and that moves and flows easily.
Click View Project below to View a demo.

Video Lesson – Mail Merge
 Mail Merge using: Camtasia video edit; Screen Capture.
Click View Project to View a Demo
Below are files used for this session, feel free to try for yourself.